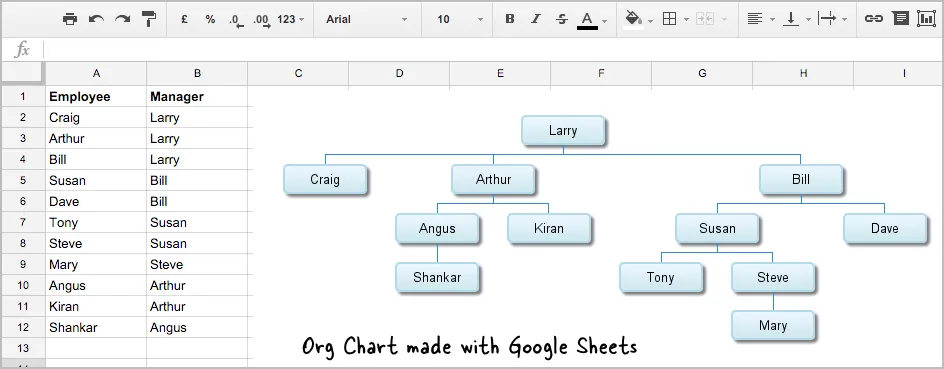
Do you need a quick organization chart to show the hierarchy of employees in your business? Well, just open a blank Google Spreadsheet, put the employee names in a column and your org charge should be ready in minutes. Here’s a sample org chart created with nothing but Google Sheets.

Create Organizational Charts with Google Spreadsheets
Here’s how you can put together an org chart in Google Sheets. It will be a live chart meaning as you update the employee names or hierarchy in the spreadsheet, the org chart would update itself. Let’s get started.
Step 1. Open a Google Sheet and put the employee names in column A and the names of the immediate managers in Column B.
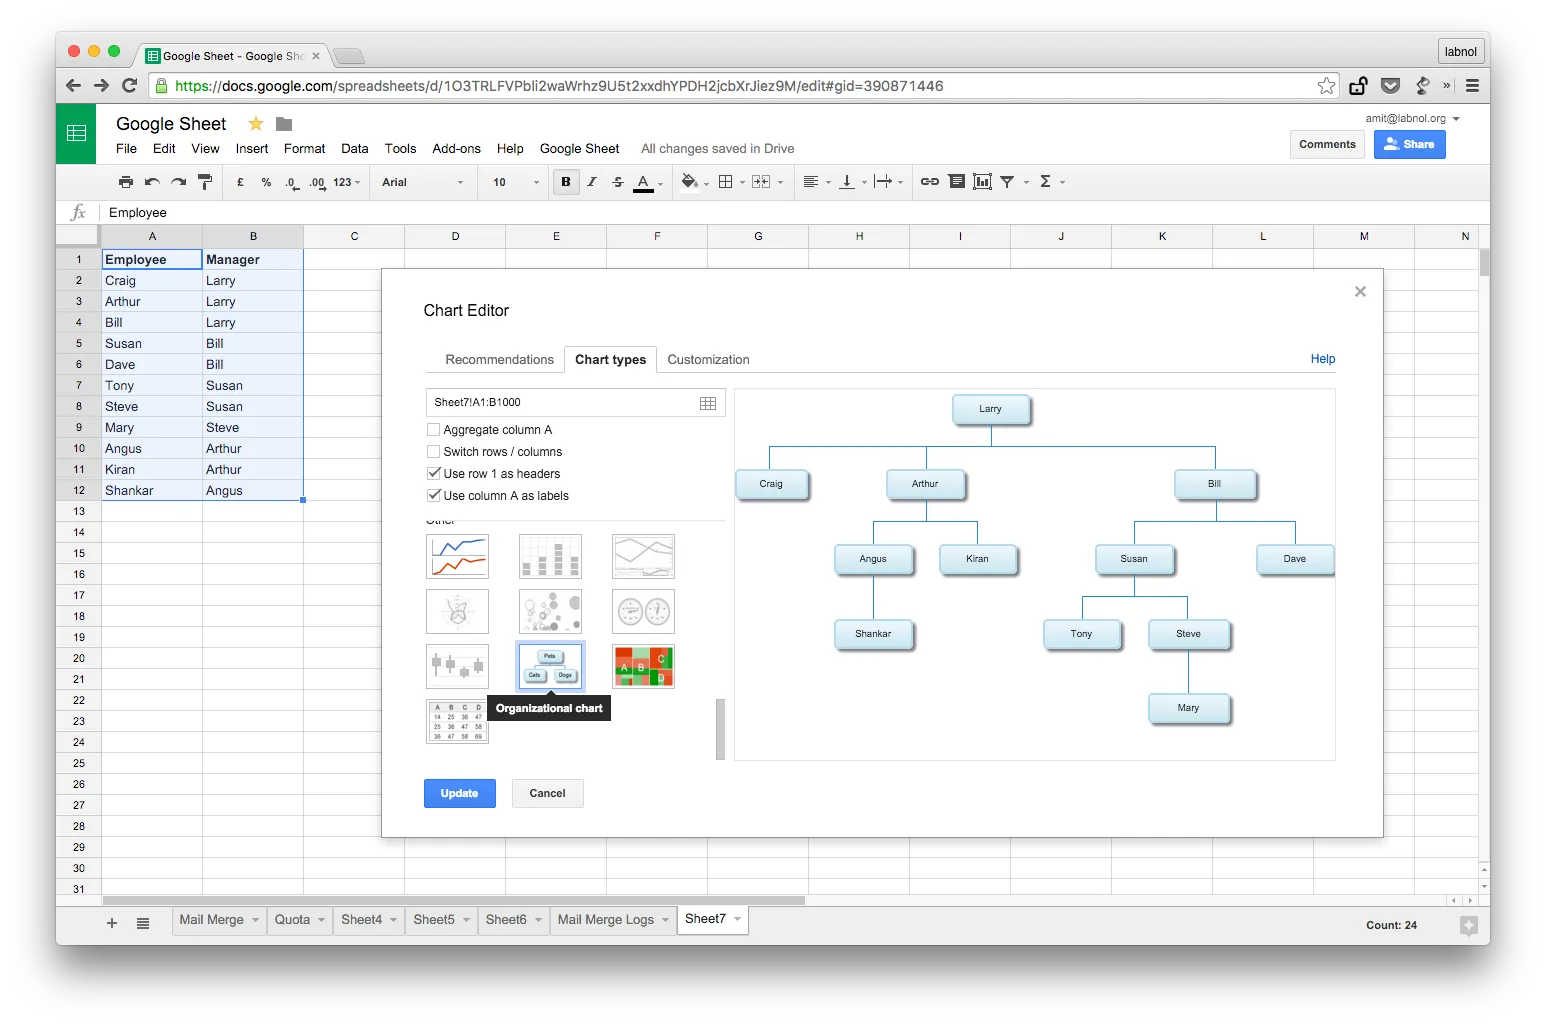
Step 2. Select the cells that you’ve just entered and choose Chart from the Insert menu in the spreadsheet.
Step 3. The Chart Editor will open inside Google Sheets. Switch to the Chart Types tab and uncheck the option that says “Aggregate Column A.” Then scroll down the list of available chart types, choose “Organizational Chart” and click Insert to add the chart into your spreadsheet.
Unlike flowcharting tools like Visio, you don’t have enough formatting options for org charts in Google Sheets except for changing the background and fill colors of various nodes in the chart. And if you hit the little drop-down arrow in the chart box, you’ll see an option to download the charge as a PNG image for embedding on other websites.


