 Building an Affinity Diagram on the Whiteboard. Credit: cmu.edu
Sometime back I attended a brainstorming session where people had to share opinions about mobile phones and also come up with ideas that could make phones less complex for the common man.
We would write down our ideas on sticky notes (of different colors) and the organizer would then stick these notes on to a large whiteboard. The session continued until evening and by the time we wrapped up, there were a few dozen sticky notes arranged on that whiteboard.
Video: What is an Affinity Diagram
This is called the Affinity process and what we ultimately had on the whiteboard is called an Affinity Diagram. It was fun but imagine how cumbersome it would be to put all that information into a spreadsheet and then re-create the affinity map on a computer later.
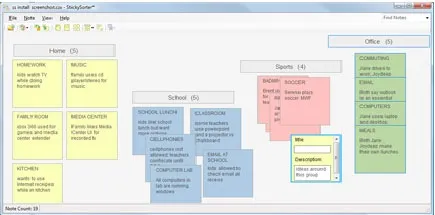
 Microsft Sticky Sorter interface
To solve this problem, the very innovative team of Microsoft Office Labs today release a new software – Sticky Sorter - that makes it very easy to create affinity maps on the computer using data that you have saved Excel or CSV files. Watch the following video to learn more about the Sticky Sorter tool and its application.
Video: What can you do with Microsft Sticky Sorter tool.


