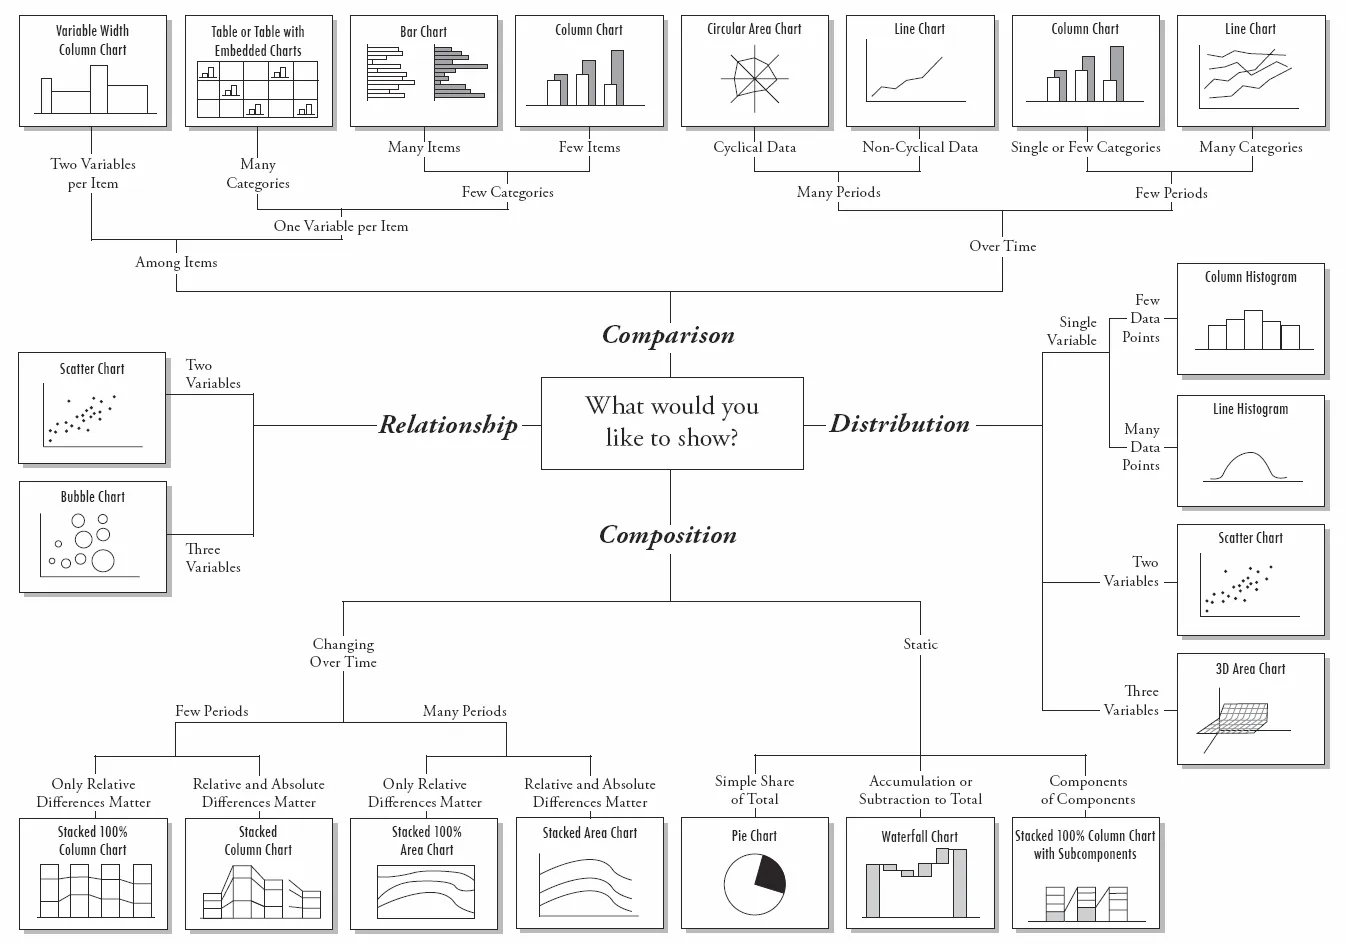
 Find the Right Chart for your Data Type
Charts help you visualize numeric data in a graphical format but the problem is there are just too many types of charts to choose from. You have bar charts, bubble charts, pie charts, line histograms and so on.
If you are finding it hard to pick the right chart type for your type of data, refer to chart chooser diagram. Start from the center of the chart chooser diagram and take the route that best matches your data type. Is the data static or does it change over time? Does the chart show a comparison or relationship between data? You may sometimes have to draw more than one chart.
The poster, designed by Andrew Abela, is also available as a PDF.
Related: Create Graphs Online with Google Charts
You may also want to check out Chart Chooser - an online tools that lets you shortlist charts visually. Chart Chooser is not as detailed as the above chart suggestion flowchart but the advantage is that it lets you download different chart types in a format that is ready to use inside Excel or Microsoft PowerPoint.


